
Europe is a big continent with many different countries and markets. If you want to do business in Europe, you need to know how to calculate your company’s market share, average price and total volume in each of these countries and the total EU.
In this blog post, we will provide a practical example of how to do this. We will use the manufacturing industry as our example, and calculate the market share for a hypothetical company in all European countries.
Case study
To illustrate our point, let us consider a manufacturing company that specializes in one species of plywood production.
Every product has a specific customs code. The European Union utilizes Combined Nomenclatures Codes, and for birch plywood, the assigned code is 44123310 (2023)- however, in the United States, it will be a distinct number.
The EU countries Finland, Estonia, Latvia, and Poland are the product manufacturers. And the EU market is the main market for them.
Also, the EU imports birch plywood from Russia, Ukraine, Belarus, and China. Due to the Russian war in Ukraine, Russian and Belarussian plywood is not accepted anymore by the EU.
In order to accurately calculate your market share, it is essential that you have a thorough understanding of both the market and all its competitors!
However, if you are still unfamiliar with your market, select all countries outside the European Union as exporters and the EU nations as importers.
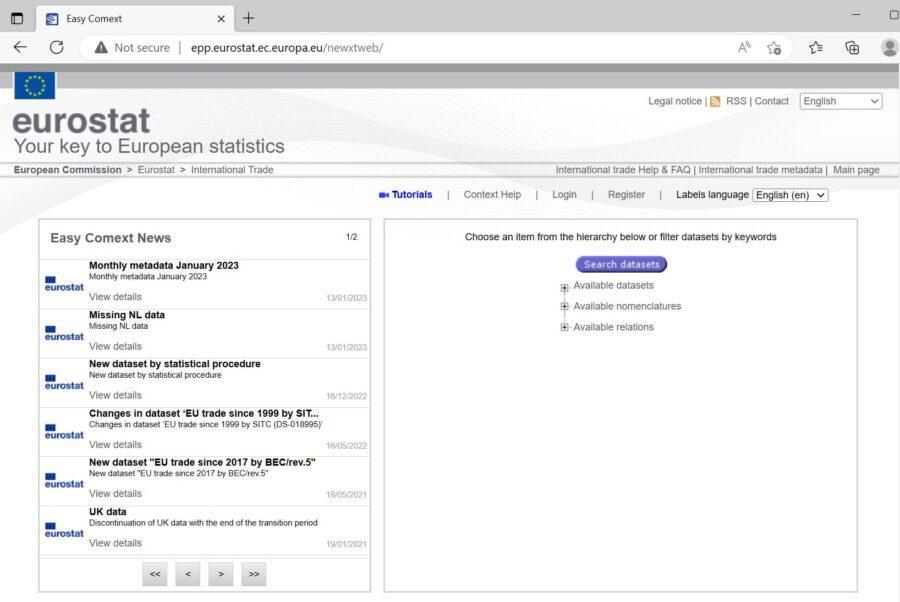
On Eurostat’s website, you will find all the official data of the European Union, and the import and export database there.
Task: Calculate market shares
Step #1: Get monthly export data from European countries (Finland, Estonia, Latvia, Poland) in all available units in the desired period to every the EU country
As Finland, Estonia, Latvia, and Poland are in the EU (European Union), you should choose exports from these countries, and choose units: supplementary unit (in this case m3), Eur, and kgs.
If you are looking for accuracy, selecting monthly data is the best choice as yearly data will contain more errors and inaccuracies. To collect data for the entire year, simply sum up the numbers from each month.
To guarantee accuracy in data, select an export to every country within the European Union. To unify the EU market, you must sum all country’s data together.
How to get data:
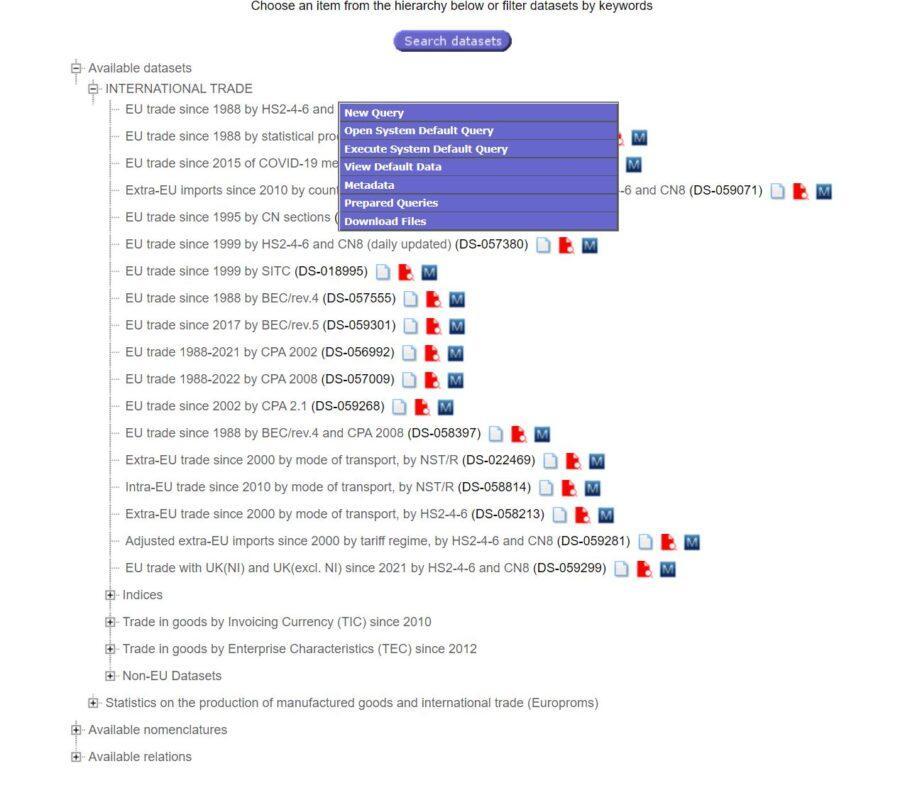
- Select “Available data sets”
2. Choose “EU trade since 1988 by HS2-4-6….” and choose “New Query”
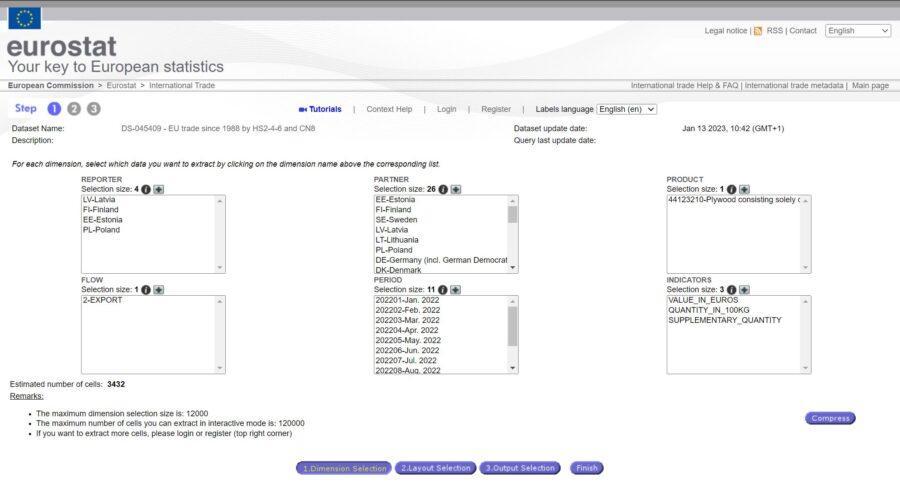
3. Select all necessary dimensions and parameters of data (you can choose from the list or select all)
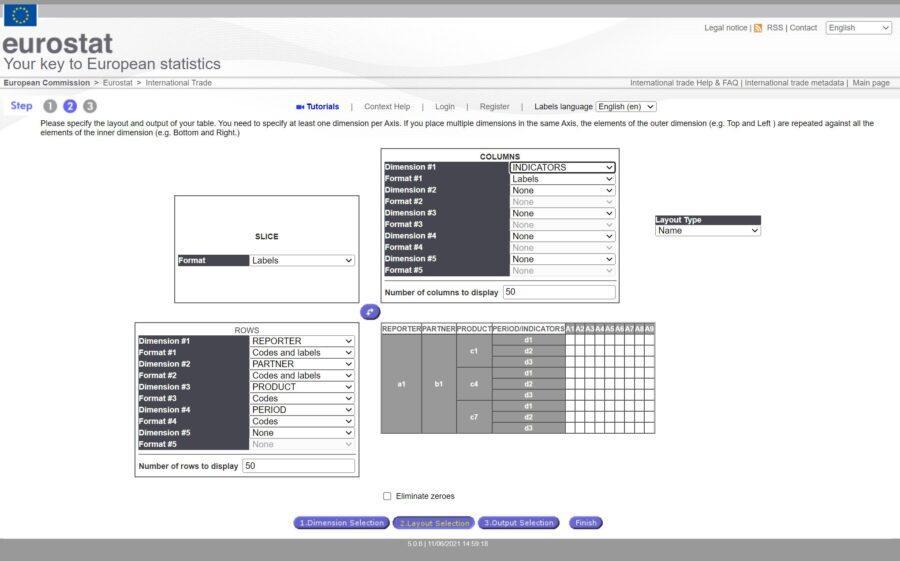
3. Select layouts. If you’re looking to process data, selecting indicators in columns is the way to go.
4. Finnish and get data. Output – in Excel for processing and analyzing.
Step #2: Get monthly import data to European countries (Ukraine, China, and (due to war in Ukraine, you can ignore Russian and Belarussian import data) in all available units in the desired period
After completing the first step by acquiring monthly data from each European country, your next move should be to acquire import data from countries outside of the EU to every EU country.
To acquire data on an annual basis, you will combine data from the entire 12 months.
To get these data do again like in step #1, but now it will be import data.
Step #3: Now you should combine data from step #1 and step #2 in one table.
It is essential to ensure that your data does not contain any errors or abnormalities. In this case, you should calculate
- the average value per unit (=average price, eur/m3) for every row
- product density (=kg/m3) for every row.
Step #4: Correct errors
After this calculation, you will see any abnormalities. If there are any, you should correct them.
As you have 3 units, 2 of them at least must be correct.
The most important units for the plywood industry are price and m3. Usually, typical mistakes are in supplementary data (in this case m3).
As we know birch plywood’s average density is 700 kg/m3, we can easily correct mistakes in supplementary data by kgs x 0,7.
Step #5: Now you can analyze data per country per month or you can sum all data and get the total EU market.
You can use Excel Pivot Table to get all neccessary total sums or market shares %.
Conclusion
If you need help with calculating market statistics or navigating through Eurostat’s database, our team of experts are ready to assist you every step of the way. From helping with research and analyzing data points for accuracy to creating competitive analytics – we can do it all!